Let me start this off by prefacing that i made my room just a little smarter, nothing too crazy. This post is going to be about how i used a Raspberry Pi, Python, Grafana, Prometheus, Docker and some sensors that i picked up from AliExpress for a few bucks.
So what the hell did i make?
Well, take a look for yourself;
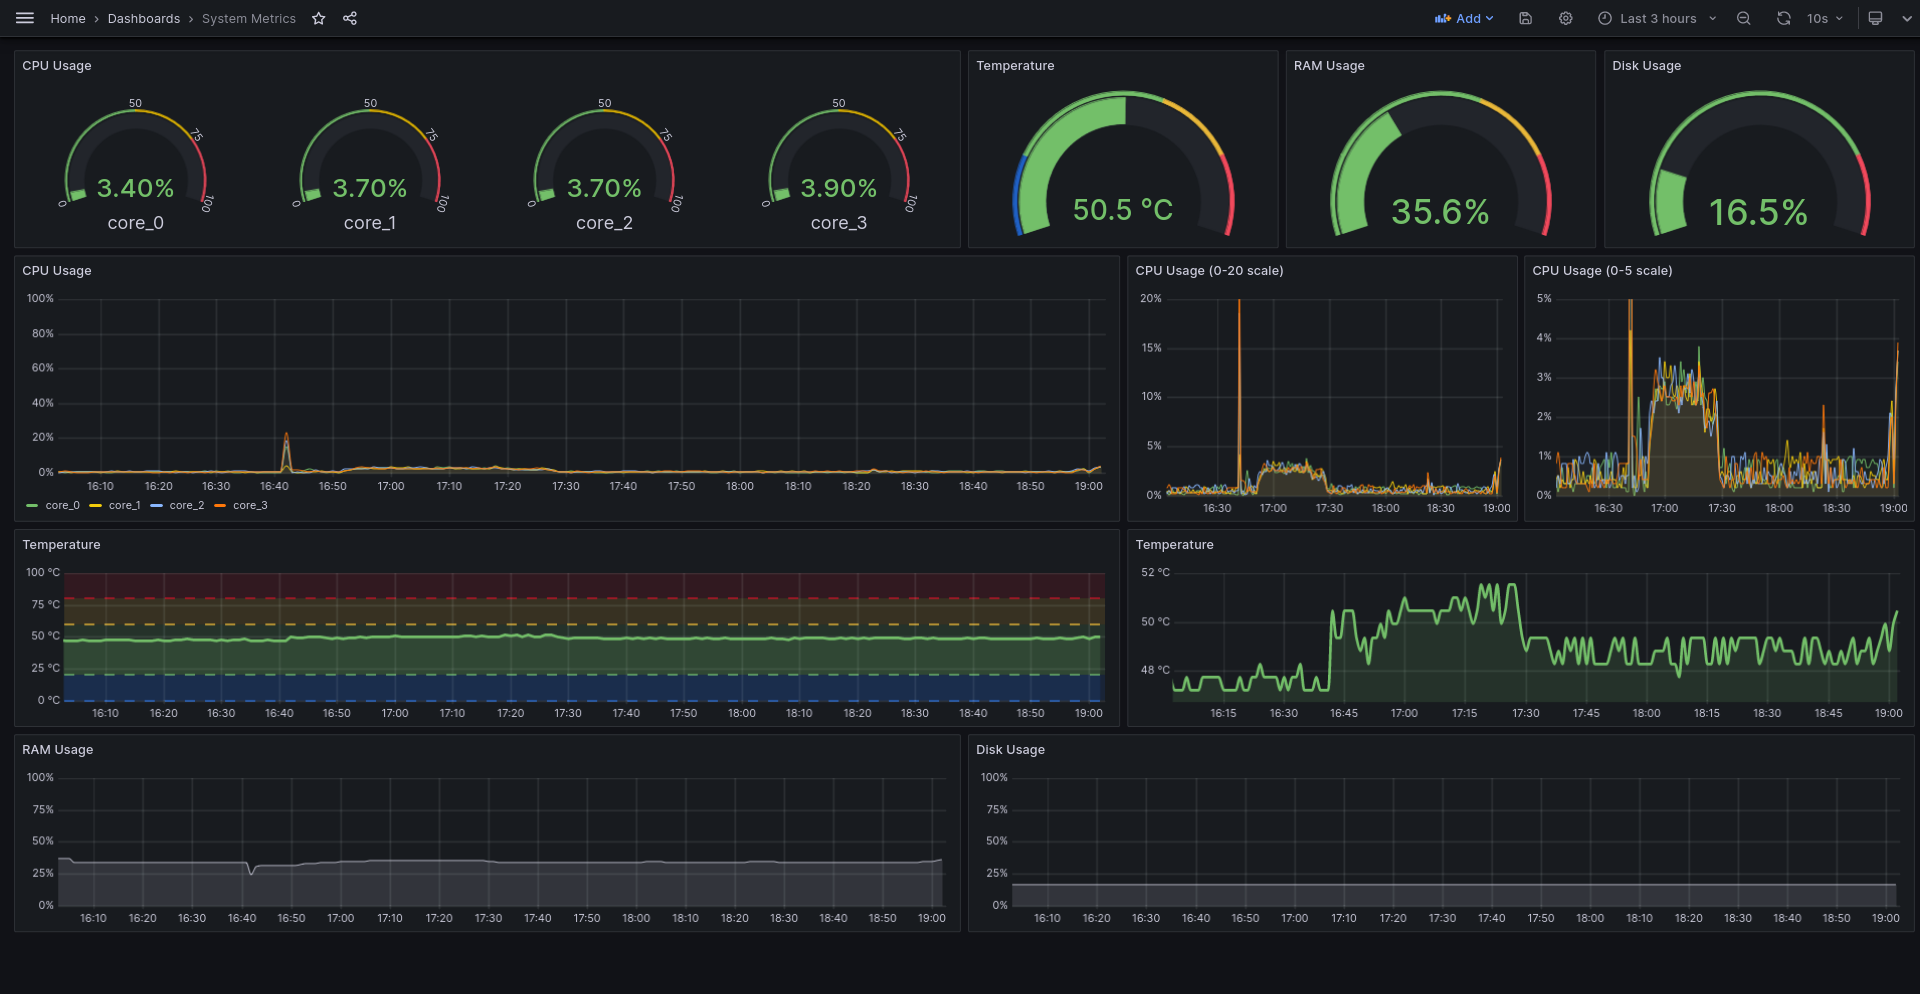
| OpenweatherAPI & System metrics | Bedroom & Bathroom |
|---|---|
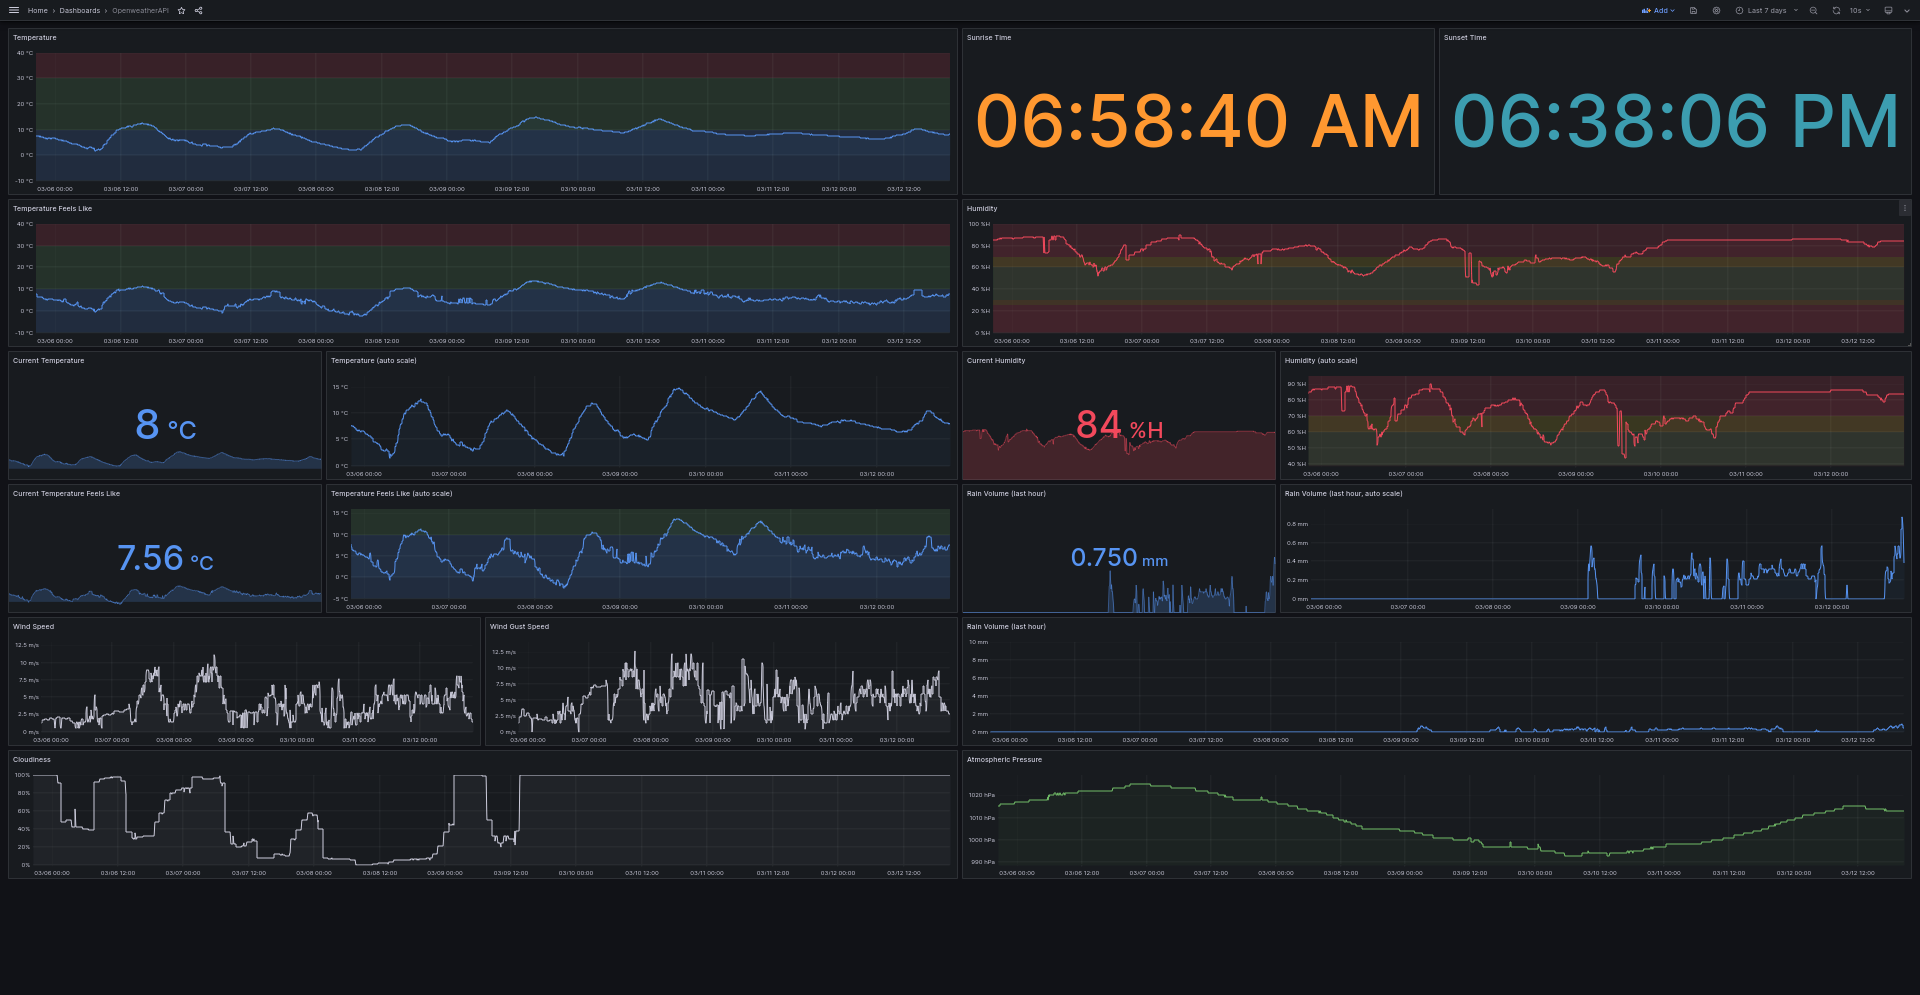 | 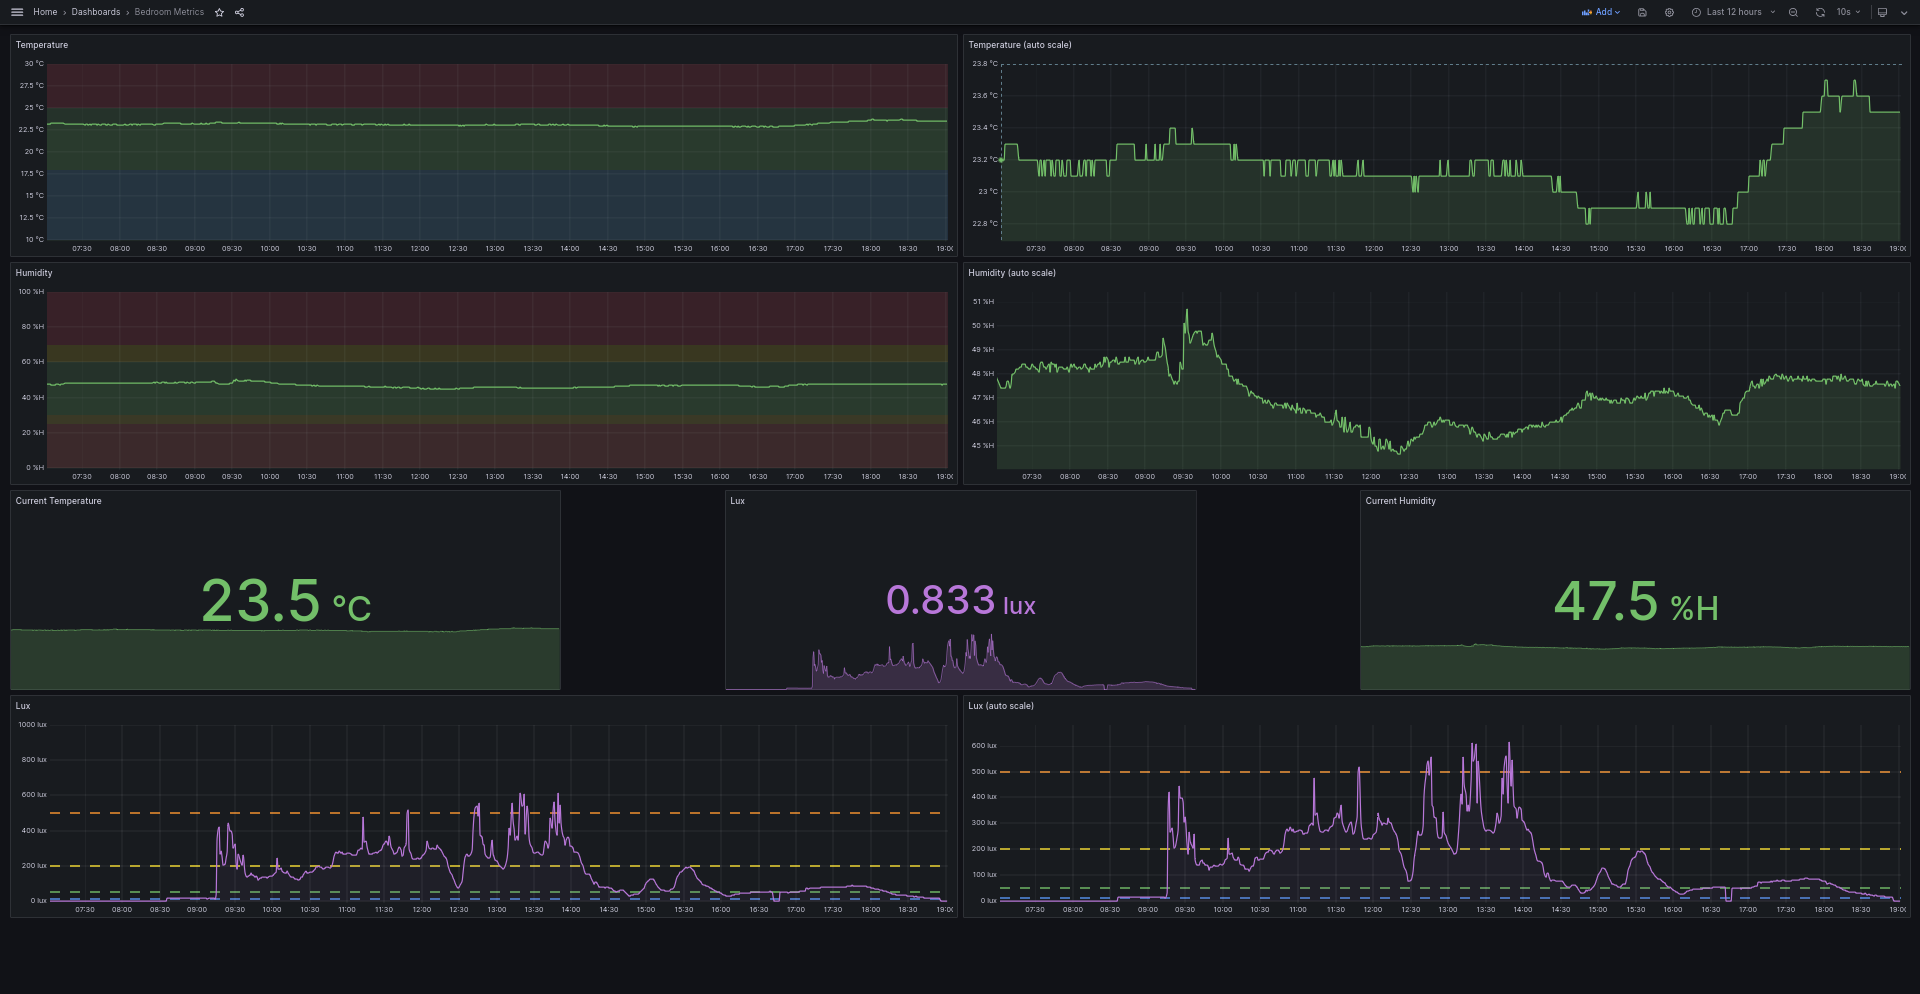 |
 | 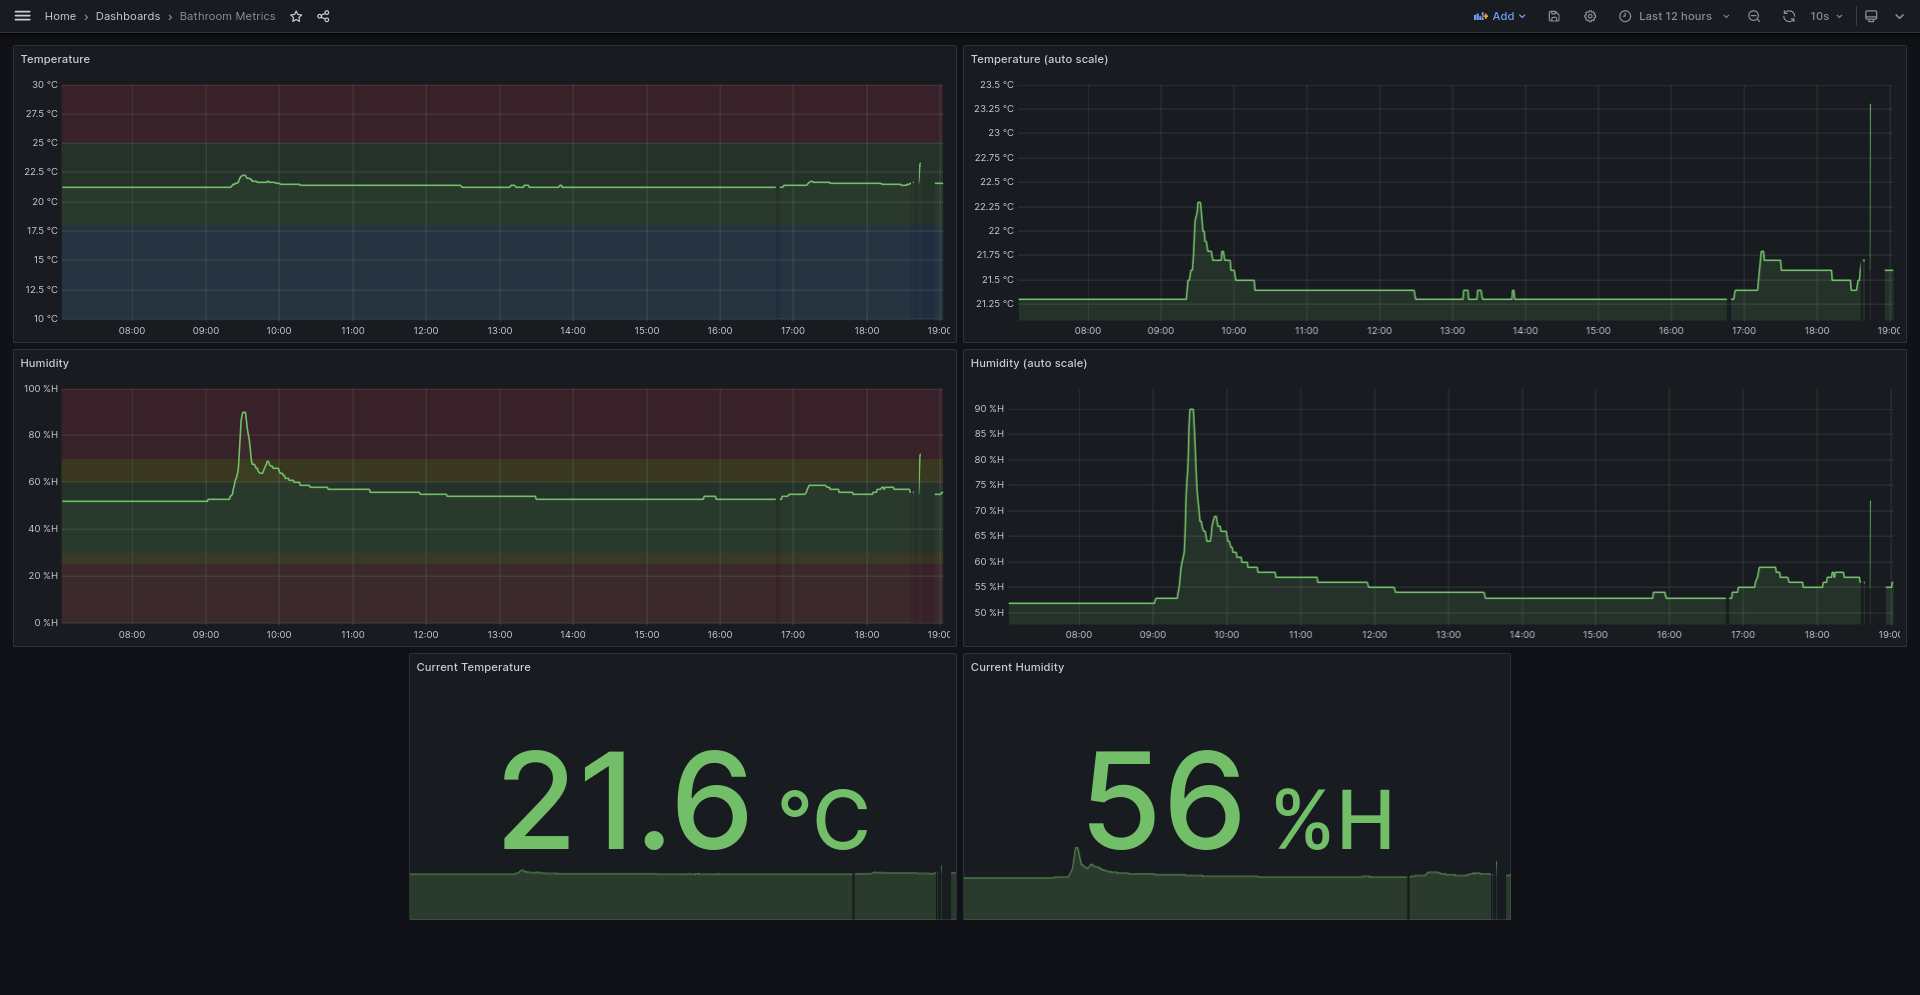 |
What you see is a couple of dashboard that allow me to monitor a bunch of metric in and around my room. A dashboard has been created that allows to me track the temperature and humidity in by bed and bathroom. In addition to tracking those two in my bedroom i also track the light intensity, I could’ve done that in the bathroom too but who cares about that if we’re being honest here.
In addition to that I also track the system resources of the Pi its running on, and i track a bunch of metrics from outside my room (the feels-like temperature, the temperature, the humidity, the pressure, the wind speed and a bunch of others.)
If you’re interested in setting this up for yourself I have made a howto which you can find on the GitHub page.
What did i need?
Like previously mentioned i used a Raspberry Pi, Python, Grafana, Prometheus, Docker and some sensors from AliExpress.
Raspberry Pi
The rpi is going to host everything I’m going to be talking about. You might wonder why i opted for this option, and it’s quite simple to be honest; i had it laying around. If i didn’t have a rpi available to me i probably would’ve used something cheaper. I think my project should be portable to anything else, but i don’t have access to those to test. Mileage may vary! The rpi is a great low-power option, but not as cost effective these days (sadly).
Python
I ended up using this because it’s just easy to develop in. Lots of examples to be found online, and modules to read my sensors ready to go. Soydev alert!
Grafana
I ended up picking Grafana because it’s a great at visualizing and processing data. This component is responsible for the actual dashboard. Later I’m going to be talking about what components i use to actually gather the data, but firstly I’m going to be talking about what I’m using to visualize it. It’s honestly been a pleasure to work with. It was a breeze to setup and get every service hooked into it. It aims to make creating beautiful dashboards a breeze, and its succeeded in this. After creating my first dashboard and playing around with it a bit i was hooked, it’s made visualizing my data a pleasure.
Prometheus
This is a bit more technical, but it’s an essential component to this project. I leaned towards Prometheus primarily because it’s a powerhouse when it comes to monitoring and data collection. This tool offers me a centralized hub for all my monitoring needs. This tool scrapes the data from my various python script and stores these metrics. You can essentially look at it as being the backbone of the monitoring setup. A python script collects the data from a sensor, and Prometheus is responsible for scraping this data, and allowing it to be visualized in Grafana.
I picked this because its very extensible. It allows me to easily scrape endpoints and store said data. To give an example, i also have a ESP32 in my bathroom responsible for collecting the temperature and humidity. What Prometheus allows me to do is very easily scrape this data from the ESP, and publish it too the rpi. This means that i can have x amount of devices communicating with my dashboards all on their own. Want to add a sensor? Just tell Prometheus to scrape said sensor and that is that. Very extensible, very cool. It’s like having a smart assistant who’s always keeping an eye on things.
Docker
This one is also a bit more technical, and i didn’t necessarily need to use it. I could’ve gone the traditional route, installing each component directly onto the Raspberry Pi. But think of Docker as my way of wrapping everything up in a nice, portable package. It really excels at making everything reproducible, allowing you to easily run my stack if you so please. It also allows me to clean up some code, and call a single command to get my entire stack up and running!
I used two services that docker offers; a compose file and a dockerfile. What the compose file allows me to do is define each service individually. It allows me to pass arguments, define rules, and the likes. The dockerfile is used so i can transform all my python scripts into a neat little service i can call from the compose file. It also allows me to define dependencies, and the likes.
Sensors
I ended up using a DHT11, DHT22 and a BH1750. I honestly wouldn’t have used the DHT11, but i had it laying around. If i had the option i would’ve used the DHT22 twice.
The DHT11 and DHT22 allow me to monitor the temperature and humidity in my bathroom, and bedroom respectively. The DHT22 is just a better, more accurate version of the DHT11.
The BH1750 is a lux monitor. It allows me the measure the light intensity.
I might pick up a CO2 monitor, but these are a bit more expensive and i didn’t really feel the need to.
Let’s get a bit more technical.
In this section I’m delving a bit deeper into how i got each building block up and running. If you don’t care, you’d just skip ahead to the next section (i promise you wouldn’t hurt my feelings).
Let’s start with the python scripts, which you can find here. I’ll get into the *_metrics.py first. These are the script responsible for collecting the metrics from all the different endpoints. They create a Prometheus gauge, allow me to read the data, and push them to a gauge. In the main.py i setup a Prometheus server, read the data from the various metrics and publish them.
I collect data from all the previous sensor but i also got a little fancy with it. In addition to collecting metrics from the different sensor i also do API calls to the openweatherAPI. However you need a API key, and some additional location information for this to be effective. That’s where the config.py comes is. Because i define these scripts as a docker compose server i can pass the variables from the .env file to this. In other words, you get a API key, your LAT and LON and put these into the .env file. Docker compose passes these through to the container, and config.py retrieves these and allows me to correctly pass said variables to my script that collects the metrics from the openweatherAPI. It effectively allows me to not dox myself online, and allow you to not have to modify code. Very cool!
In the main.py i setup logging, the Prometheus server, and its where i systematically query easy metric collection script. I query each script, then publish the results to a Prometheus server.
Whilst we’re on Prometheus, it’s what I’m going to delve into next. This is setup as a separate service from what I’ve previously talking about. We have a bunch of Prometheus servers running, some on the rpi as a python script and another on the ESP in my bathroom. What the Prometheus service allows me to do is query each of these separate running server and save their data. All i needed to do was create a configuration file where i tell the service what to query. In my case it has to query the python scripts, and the ESP32 in my bathroom.
Okay, now we can query and store the data from all of my sensors and my devices but how do we process and visualize it? That’s where Grafana comes in it. Defined as another service in my docker compose I’ve also kept provisioning in mind, allowing me to connect to the Prometheus backbone and make my dashboards stateless. Effectively what this means is that the dashboards and data sources aren’t only saved in one container, meaning that when it gets wiped, i don’t need to set those up again.
Whilst talking about docker ill talk about what I’ve setup. We have a docker compose file where i define each service, pass the correct variables and or files and give it the correct port mappings. This allows me and you to simply run the compose file and get each service up and running. I use a dockerfile to containerize my python scripts. I played around with GitHub Actions to automate and crosscompile for the rpi but this ended up not being worth it. No time was to be saved by downloading a pre-build container and I’d have to solve a whole bunch of dependencies issues because I’m compiling them on a different architecture. I didn’t feel like solving these issues to maybe save a few seconds and run into issues on devices i can’t test with. You’re gonna have to build it yourself, ya filthy animal!
In other words, everything that I’ve setup is pretty user-friendly. All the user is expected to do is configure their jobs in the prometheus_config, and run the compose file.
In conclusion
It’s been a fun project to work on that’s brought me some insight into my room and what’s going on around it. It’s not something that i really needed, but it sure is a nice addition for a few bucks spent. On a quick calculation i spent around 7 bucks on it. Most of that budget went to the ESP32, which cost me ~4 euros. I was lucky to have a bunch of stuff already laying about like the Raspberry Pi, a breadboard, the DHT11 sensor, jumper wires,… The only things i needed to get were the DHT22, BH1750 and the ESP32. I could’ve built this project using only what i already had laying around (which i did and you can find here) however this solution felt a bit too simple for me, so i expanded into what became this project.
The GitHub
You can find that -> https://github.com/axelvanherle/raspi-room-monitor <- there.